


.png)
.png)
Before getting to the technicals on Treasury bonds, let me state why I am interested in and why I write so much about Treasury bonds. In one word, it is diversification. After all, they move slowly (most of the time), and they don't have the pizazz of some hot stock. Treasury bonds are one asset that remains negatively correlated to the equity market. Other traditional portfolio diversifiers, like commodities, emerging market ETF's and REIT's, have become highly correlated to US equities, and they just aren't doing the job they used to of smoothing out a portfolio's returns.
We last looked at Treasury bonds on March 25, 2010 when I wrote "Higher Yields, Lower Equities?". In that article, I wrote that "the technicals have me bearish on bonds" and the fundamental driver for higher yields was one of supply and demand as sovereign debt issuance over the coming year was going to result in higher yields. In essence, higher yields would be the result of increasing supply of debt not an expanding economy, and yield pressures would be a headwind for equities. Thus, we would see an environment of higher yields and weaker equities, which was not the prevailing view at the time. The prevailing view appears to be that Treasury bonds are a safe haven -non risk asset - in times of stock market turbulence.
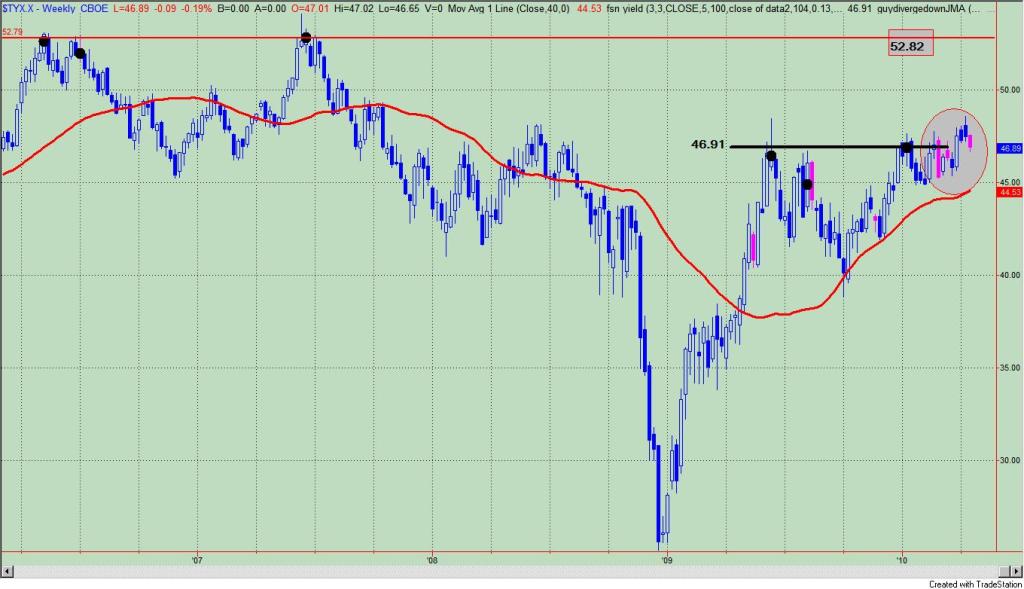
Three weeks later (and a different month), yields haven't accelerated higher as the technicals suggested, and they are at risk of reversing. This can be seen in figure 1, a weekly chart of the yield on the 30 year Treasury bond (symbol: $TYX.X). The block dots are key pivot points. 4 weeks ago, a close over the most recent key pivot point at 46.91 (or a yield of 4.691%) was bullish, but as we start this week, bonds are being bid up (lower yields), and we are testing the break out point. A weekly close below 46.91 would suggest that the breakout was a fake out, and lower yields will prevail.
Figure 1. $TYX.X/ weekly
We can get a different view of this situation by looking at the i-Shares Lehman 20 + Year Treasury Bond Fund (symbol: TLT). See figure 2, a weekly chart. Key pivot points are identified in black, and as you can see, prices are probing above the recent key pivot point or support level at 89.38. A weekly close above 89.38 would be reason enough to be long TLT with a stop loss on a weekly close below 87.30, which was last week's low.
Figure 2. TLT/ weekly

In the ARL Advisers' Real Time Portfolio, I am long the Ultra Short Lehman 20 + Year Treasury (symbol: TBT). In other words, I am betting against bonds. However, by the end of the week, I could be wrong, and this would require me to close out my position and initiate a position in the TLT. While whip saws are never enjoyable, I am following my methodology.
Finally, I must keep in mind that my biggest fear may be realized and that Treasury bonds and yields are going to remain range bound - never trending higher or lower - thus creating a choppy trading environment where my longer term strategies are prone to whipsaws. Ugghhh!
In summary, I am watching Treasury bonds closely as a reversal may be in the works.


.png)
1 comment:
They are in a trading range
Post a Comment