Saturday, January 31, 2009

On Holiday!!

I am on holiday and I will return to this blog on Monday, February 9.

Don't forget to read this week's post on "Investor Sentiment: Good Timing".


Investor Sentiment: Good Timing

It was quite a week for me personally and for the markets as volatility returned. The direction for the markets remains down.

Briefly, about my situation. I live in the Midwest, and we were hit by 2 days of very severe weather; I have been without power for 5 days and counting. A hassle yes but not the end of the world. I am able to get on line, but my focus has not been the markets. However, this is one of the benefits of a quantitative approach like mine as I know ahead of time how I will navigate in the markets. In other words, I don't have to sit and watch the screen all day as I can put my orders in and walk away.

And that is what I did. I executed what I said I was going to do in last week's "Key Price Levels: January 27, 2009". As pertaining to the SPY (S&P500 proxy), I quote: "resistance remains at 86.78, and in the current market climate (i.e., neutral sentiment picture plus short term overbought -see below), this would be the ideal low risk spot to bet against the market on any spike in prices."

I still believe the market is headed lower, and as I have been stating for weeks, the time to get bullish will be when everyone else is bearish. As we can see from the "Dumb Money" indicator in figure 1, there are still too many bulls trapped on the wrong side of the trend. The "dumb money" looks for extremes in the data from 4 different groups of investors who historically have been wrong on the market: 1) Investor Intelligence; 2) Market Vane; 3) American Association of Individual Investors; and 4) the put call ratio.

Figure 1. "Dumb Money"


The "dumb money" is neutral on the markets, and they have been that way for 8 consecutive weeks and prices on the S&P500 have fallen about 6%. While a 6% drop over 2 months is not earth shattering, on an annualized basis it is significant. Furthermore, the Feds and Treasury have thrown everything at this market (including the kitchen sink), yet there is very little upside traction. Oh, did we forget the January effect, and how bullish the month would be? January, 2009 turned out to be the worst January ever (down almost 9%) for both the Dow Industrials and S&P500.

The "smart money" (see figure 2) refers to those investors and traders who make their living in the markets. Supposedly they are in the know, and we should follow their every move. The "smart money" indicator is a composite of the following data: 1) public to specialist short ratio; 2) specialist short to total short ratio; 3) SP100 option traders. The "smart money" is bearish on equities and has been so for 14 consecutive weeks.
Figure 2. "Smart Money"

While my situation seemed rather dire to start the week, it has certainly perked up. I will be on holiday for the following week; this was scheduled and did not have anything to do with the bad weather. It was just good timing, and good timing is always better than bad timing.

I will return to the blog on Monday, February 9.

Tuesday, January 27, 2009

Breaking News

The breaking news is that there is no breaking news!

CNBC does it. The Wall Street Journal (digital edition) does it. Fox News does it too. It's the breaking news story.

Most of the time it isn't breaking news, but news that we know is coming. It is expected. It isn't breaking. A good example are the government data releases, like unemployment numbers and CPI, that occur almost daily at 8:30 a.m EST. From CNBC's perspective the purpose of these data points is not for thoughtful analysis of the current economic situation but as a number that can make the stock market "pop" 2%. CNBC may discuss "the number" but in general, if it is a "bad number" -one that does not cause the market to rise - it is quickly forgotten and the search for the next market popping story is quickly sought.

And why are breaking news stories generally bullish? Or why don't we see more bearish breaking news stories? These stories are just reported as the news.

I find that the breaking news stories are coming with greater and greater frequency these days, and I often wonder if it isn't a function of the bear market. The story on the ground seems rather bleak. Unemployment is rising, confidence is falling, and uncertainty is high and rising. However, the breaking news story offers hope. There is the hope that things are getting better (although we all know that one data point doesn't make a trend). There is the hope that our elected officials will "save" us and the economy. Can anyone say, "Tarp 2, Tarp 3, Tarp4"? I am not sure why this offers hope that our stewards of the economy will now get it right. We are told that it must be even though the last umteenth interventions didn't work. Oh less we forget, the same folks who were watching the candy store before this mess began are still behind the counter !!! Doesn't anyone ever question this?

The real story, as always, is somewhere in between the hope of the bulls and the reality of the bears. Yesterday, the bulls served up a good bit of hope. The government is going to buy bad assets from the banks and in the process save us and save the economy, etc. Why this was breaking news I am not sure. This was expected. But that was the spin, and this is what got the bulls all whipped again. The ball is now in the bears' court and in all likelihood, they will be serving up a good dose of reality. The ball will then be back in the bulls' court.

Back and forth they go, where they stop no one knows.

I suspect that the bottom for the stock market and the end of our economic malaise are somewhere off in the future. The breaking news story will no longer be breaking news as all hope will have been squashed.

Key Price Levels: January 27, 2009

With support levels in the major indices having fallen over the last couple of weeks, we are beginning to see volatility increase as the bulls are losing ground (or is it a grip on reality). Every new data point is spun bullishly, is capable of reversing months of bad news, and is good for a spike in prices at least for 45 minutes. The good news is that the November lows are still holding. For the most part, the major indices are travelling within well defined trend channels.

To review the methodology and the significance of the key price levels please click on this link.

My interpretation of the SPY (S&P500 proxy) chart (see figure 1) is as follows: resistance remains at 86.78, and in the current market climate (i.e., neutral sentiment picture plus short term overbought -see below), this would be the ideal low risk spot to bet against the market on any spike in prices. The November lows were tested last week, and so far they have held.

Figure 1. SPY/ weekly


Figure 2 is a weekly chart of the Dow Jones Industrial ETF proxy, the Diamond Trusts (symbol: DIA). The break of the maroon trend line is bearish and typically such trend line breaks should lead to an acceleration lower in prices. A spike into the trend line at $85 would be the place to bet against the market.

Figure 2. DIA/ weekly

Figure 3 is a weekly chart of the Power Shares QQQQ Trust (symbol: QQQQ). 29.36 to 29.72 is the key resistance that the QQQQ is struggling with.

Figure 3. QQQQ/ weekly
Figure 4 is a weekly chart of the i-Shares Russell 2000 Index (symbol: IWM). IWM is no man's land as prices remain in the middle of the channel.

Figure 4. IWM/ weekly


Lastly, Figure 5 is a daily bar chart of the PowerShares QQQ Trust (symbol: QQQQ); the indicator in the lower panel is our short term oscillator constructed from breadth and sentiment data. The indicator remains in over bought territory.
Figure 5. QQQQ/ daily

Sunday, January 25, 2009

Gold: Let's Try This Again

My last post on gold was a great display of market timing. Unfortunately, I didn't say "Buy gold as it is going up 5% today." That would have been timely. The only thing timely about my analysis was that I happened to publish it on a day that gold "popped" 5%.

Ok, so what does the recent strength in gold mean? (Good question by reader JT ~ thank you!)

Despite Friday's strong showing, gold still remains in a trading range. Figure 1 is a weekly chart of continuous gold futures contract showing gold at the upper end of that trading range. But for me the question is this: is this the launching pad that will lead to a multi -month price move in gold?

Figure 1. Gold/ weekly


I still don't believe so. I am basing my statement on the fact that every strong move in gold since the 1970's was preceded by the "next big thing" indicator being bullish or a prolong period of consolidation. Look at figure 2, a monthly chart of gold going back to the early 1970's.

Figure 2. Gold/ monthly


The "next big thing" indicator is in the middle panel, and remember, all this indicator does is identify the high likelihood for a secular trend change. (We use technical analsysis to confirm the trend change.) This indicator quantifies a multitude of technical factors seen at market bottoms, and it works across multiple markets. The "squeeze" indicator in the lower panel looks for statistically relavent periods of low volatility. It is these contractions in the price range over many months that leads to a launching pad for a new secular trend even when the "next big thing" indicator is neutral. The vertical lines identify the best times to have been invested in gold, and as you can see, the "next big thing" or "squeeze" indicators were positive for a trend change.

Now to the current market, and neither of these technical factors are positive. Now it doesn't mean that gold won't be higher in 3 months, but if past history is any guide, I don't see this as a launching pad to a new bull market.

Lastly, let me show an updated graph (figure 3) from the recent article, "Gold: Relative Performance v. Currencies"; the indicator, which looks at 8 currencies relative to gold, still has not turned up. I thought that the observation made by one of our readers (Guru) that this was the 4th or 5th pivot in the down trend of the indicator was insightful, and I believe it has merit. This would be a good place for downtrend to end. However, even with Friday's strong action, the indicator has not broken out of its downtrend. Being a relative strength type indicator, I would expect the indicator to lead the price of gold higher.

Figure 3. Gold/ weekly


I will continue to follow.

Investor Sentiment: Waiting For Our Pitch

Investor Sentiment: January 26, 2009

The "dumb money" sentiment indicator remains neutral on the equity markets, and the "smart money" remains bearish. It should be noted that this is the seventh week in a row where the "dumb money" is neutral, and this is not a scenario that is generally supportive of higher prices especially with prices on the S&P500 under their 40 week moving average. The ideal situation for higher equity prices would be for the "smart money" to be bullish and the "dumb money" bearish (i.e., bull signal).

The "dumb money" or investment sentiment composite indicator (see figure 1, a weekly chart of the S&P500) looks for extremes in the data from 4 different groups of investors who historically have been wrong on the market: 1) Investor Intelligence; 2) Market Vane; 3) American Association of Individual Investors; and 4) the put call ratio.

Figure 1. "Dumb Money"


The "smart money" (see figure 2) refers to those investors and traders who make their living in the markets. Supposedly they are in the know, and we should follow their every move. The "smart money" indicator is a composite of the following data: 1) public to specialist short ratio; 2) specialist short to total short ratio; 3) SP100 option traders.

Figure 2. "Smart Money"


Volatility has returned to the markets. Intraday price swings are huge. All this is good for the day trader, but for those looking to catch a multi week price move, these sudden and sharp swings can produce moments of anxiety as those on CNBC breathlessly proclaim that the "bus is leaving the station" after every 2% reversal.

It is never easy being out of the market waiting for your pitch. This notion is the antithesis of everything we are told about the markets - "buy and hold" or "buy for the long term" or "you cannot time the market" . However, the sentiment data suggests that we should not see higher prices until the "dumb money" becomes more bearish. This is the most likely outcome. For investors to become more bearish, we need to see lower prices or a prolonged trading range that wears investors out. Of course, lower prices will most likely turn the "smart money" more bullish.

Thursday, January 22, 2009

Gold: Relative Performance v. Currencies

The last time I looked at gold was on January 2, 2009. Gold had closed above its "simple 10 month moving average and above a down sloping trend line formed by two prior pivot high points."

I went on to state: "Typically and on a purely price action basis, I would consider this bullish. However, for gold, these technical milestones have failed to produce any meaningful edge especially when we apply other filters of the price action (such as the "next big thing" indicator). In other words, I don't believe that this represents the beginnings of a new secular up trend in gold."

This was a good "call" as gold ultimately dropped to $800 and it now rests some 3% below that week's close. The breakout was a fake out. Technically, nothing has changed with gold, and I believe it will be in trading range for many months.

The fundamentals for gold are easiest explained by the competing forces of inflation and deflation. The ultra easy monetary policies of central bankers are today's seeds that are sowing tomorrow's inflation. The global recession and popping of the commodity and housing bubbles are strong deflationary forces. That should limit the rise of gold. In essence, these fundamentals reflect how gold has performed over the past year. It was up and it was down, and in the end, it really didn't do much. However, gold easily out performed equities and other commodities.

But let's take a relative look at gold. In this instance, I am looking at the price of gold in other currencies. My motivation for this is the fact that the British Pound is hitting 23 year lows versus the US Dollar this week, which means that gold is hitting a new record high in terms of British Pounds. The currencies that I am looking at are: 1) Australian Dollar; 2) Canadian Dollar; 3) Swiss Franc; 4) Eurodollar; 5) British Pound; 6) Singaporean Dollar; 7) Japanese Yen; 8) US Dollar.

Once I determined the price of gold in these currencies, I then took a 52 week rate of change of each data series. I then combined these values into a single, composite indicator that is shown in figure 1, a weekly chart of gold.

Figure 1. Gold/ weekly


Several observations:
1) the indicator is above the zero line and this is positive;

2) in essence, when gold is rising against the majority of currencies, then the price of gold is rising;

3) the indicator is currently trending lower;

4) the series of lower highs in the indicator are noted by the "1,2,3,4" and this has been the pattern since early 2008.

In sum, with the indicator just barely above the zero line, gold is outperforming only 4 of the eight currencies measured, and as long as the indicator is above the zero line, the downside should be limited for gold. On the other hand, the indicator is trending lower, and this is not a pattern consistent with higher gold prices.

Gold's performance relative to 8 currencies is mixed. In essence, this is consistent with the competing dynamics seen with the fundamental picture. In the end, gold is likely to remain in a trading range.

Short Term Oscillator

Figure 1 is a daily bar chart of the PowerShares QQQ Trust (symbol: QQQQ); the indicator in the lower panel is our short term oscillator constructed from breadth and sentiment data.

Figure 1. QQQQ/ daily


As of this morning, the indicator is now in over bought territory, and past peaks in the indicator are identified by the purple vertical bars. The graph goes back to May, 2008.

I really thought the market would be higher this morning and prices would test resistance levels providing a low risk opportunity to bet against the market. The ETF proxies for the major indices remain in the bottom part of their ranges, but they are below resistance levels. A good example of this can be seen in figure 2, a weekly chart of the S&P Deposit Receipts (symbol: SPY). The down sloping trend channel is identified, and yesterday, prices bounced off the lower channel line; prices still remain below resistance at 86.78.

Figure 2. SPY/ weekly


From my perspective, the bulls have been bailed out again as yesterday's gain wiped away Tuesday's losses. This is how the markets have functioned on a short term basis since the top in October, 2007. If you went long and had losses, all you needed to do was wait for some government announcement to see higher prices and get out of your positions. But all of the goverment intervention won't wipe away the fact that this is still a bear market, and we have to remember to keep saying, "buy fear, sell hope".

While the markets remain in this short term sideways range, I believe the markets are headed lower. This is the essence of my two most recent commentaries on the price action and investor sentiment. Patience is warranted regardless of which side of the market you want to play, and the only thing one has lost is opportunity.

Monday, January 19, 2009

Key Price Levels: January 20, 2009

Mixed and inconsistent price action of the past couple of weeks turned to very poor price action this past week. For the second week running, support levels were decisively broken in the SPY (S&P500 proxy) and DIA (Dow Industrial proxy); the IWM (Russell 2000 proxy) broke its most immediate support level. Only the QQQQ (NASDAQ 100 proxy) held at support (just barely).

To review the methodology and the significance of the key price levels please click on this link.

My interpretation of the SPY chart (see figure 1) is as follows: the support level at 86.78, which seemed to be the key level for weeks, did not hold. This is now resistance. As expected, the break of support has led to a test and a bounce at the next support zone between 81.17 and 82.61. No surprise here. However, based upon the sentiment picture and the poor price action, I would not be surprised to see the November, 2008 lows retested.

Figure 1. SPY/ weekly


Figure 2 is a weekly chart of the Dow Jones Industrial ETF proxy, the Diamond Trusts (symbol: DIA). The DIA closed below the pivot at 82.97 and above the pivot at 82.64 (by 5 cents). However, when you connect these pivot points with the maroon colored trend line, you see the result-- a trend line break. This is bearish. Period! Historically, trend line breaks of such pivot points have implied increasing risk as prices can accelerate lower. On the other hand, reversals of these break downs do occur and are generally bullish. For now, we should respect the price action, and this is a breakdown and it is bearish.

Figure 2. DIA/ weekly


Figure 3 is a weekly chart of the Power Shares QQQQ Trust (symbol: QQQQ). This past week prices remained between the most immediate support zone; this is between 29.72 and 29.36. This is still bullish and still a "normal" pullback, but the QQQQ is barely hanging in there.

Figure 3. QQQQ/ weekly


Figure 4 is a weekly chart of the i-Shares Russell 2000 Index (symbol: IWM). The support zone between 47.58 to 48.26 has given way and is now resistance. Price are destined to hit the next support zone at 42.48.

Figure 4. IWM/ weekly


The price action has degraded over the past weeks. Support zones have not held, and the November, 2008 lows are now in sight.

Investor Sentiment: Same Story, New Week

Investor Sentiment: January 20, 2009

The "dumb money" sentiment indicator remains neutral on the equity markets, and the "smart money" has turned more bearish. It should be noted that this is the sixth week in a row where the "dumb money" is neutral, and this is not a scenario that is generally supportive of higher prices especially with prices on the S&P500 under their 40 week moving average. The ideal situation for higher equity prices would be for the "smart money" to be bullish and the "dumb money" bearish (i.e., bull signal).

The "dumb money" or investment sentiment composite indicator (see figure 1, a weekly chart of the S&P500) looks for extremes in the data from 4 different groups of investors who historically have been wrong on the market: 1) Investor Intelligence; 2) Market Vane; 3) American Association of Individual Investors; and 4) the put call ratio.

Figure 1. "Dumb Money"


The "smart money" (see figure 2) refers to those investors and traders who make their living in the markets. Supposedly they are in the know, and we should follow their every move. The "smart money" indicator is a composite of the following data: 1) public to specialist short ratio; 2) specialist short to total short ratio; 3) SP100 option traders.

Figure 2. "Smart Money"


For the past 3 weeks it has been the same story: sell hope and buy fear. If the "dumb money" indicator is any gauge, it appears that market participants are caught on the wrong side of the trend. This week the bulls remain hopeful of a post inaugural rally, but even if it does materialize, the correct course of action for those with a trading mindset is to sell strength. I define what I mean by "strength" in the article, "Investor Sentiment: Some Context".

From my perspective, it is likely that the November, 2008 lows will be tested and possibly violated. This is another way of saying, "we need more bears" before the market can go higher, and this means the "dumb money" indicator needs to turn bearish (i.e., bull signal) before a multi week trade is likely to develop.

Finally, it should be noted that the "smart money" has been bearish for 8 out of the last 9 weeks. In 18 years of data and in over 45 signals, the "smart money" has confirmed the "dumb money"in over 95% of the cases. By this I mean, we need to see the "smart money" turn bullish as a confirmation of the “dumb money” turning bearish. Typically, lower prices will make the “smart money” turn bullish.

Friday, January 16, 2009

McDonald's CEO On CNBC

When I wrote last night's article, I really had no idea that the CEO of McDonald's Corporation (symbol: MCD) would be on CNBC this morning. Of course, CNBC was out touting the stock as the Dow's best performer last year. If I was an investor, this would make me nervous as CNBC has a way of jumping on the bandwagon just as the party is ending.

I came to my "call" on McDonald's because I was just looking at the charts, and I found it kind of interesting that McDonald's is the only Dow component that has not succumbed to the bear market. Once again, McDonald's has the technical characteristics of a stock putting in a secular top.

Below is a link to a video from CNBC and it is with McDonald's CEO and Vice Chairman, Jim Skinner. Mr. Skinner discusses the prospects for his business and the economy. I have no axe to grind here, yet it will be interesting to see who is right- the CEO or the chart.

To see the video, please click on this
link.

Thursday, January 15, 2009

The Dow 30 And The Last Man Standing

Take about 20 minutes and review the charts of the component stocks that make up the Dow Jones Industrial Index.

The financials (AXP, BAC, C, JPM) are in a free fall. Only JPM remains above its 2002 lows.

The industrials (AA, DD) are basing after the fourth quarter free fall and are trading at their 1994 lows.

The pharmaceuticals (JNJ, MRK, PFE) are mixed. JNJ has gone nowhere for 7 years and while at the bottom of its range, it is not going anywhere soon. MRK is at the bottom of a 4 year range. PFE remains in a 7 year downtrend, but it has the technical characteristics of a stock that may lead to a secular trend change, so this is worth watching.

The conglomerates (GE, MMM, UTX) don't look so good either. UTX is the best of this lot as it holds above the 2002 lows. MMM is above its 2002 lows but it has broken a long term trend line going back to 1994. GE looks scary as it below the 2002 lows and appears to be in a free fall to $10.

The manufacturers (BA, CAT, GM) are up next. BA looks set to fall from its current price of $41 to the lows set in 1998 and 2003. CAT, which is now at $39, has a lot of support at $30. GM should be at zero, but Congress has seen otherwise. It does have the technical characteristics of a stock poised to end its downtrend, so I guess when you sum it up: GM isn't for the faint of heart.

The energy giants (CVX, XOM) broke down in July, 2008, and they recently retraced those loses to their down sloping 40 week moving averages. They are rolling over.

Retailers (HD, WMT) are retailers and going nowhere fast in this economy. HD is near its 2003 lows and it does have the technical characteristics of a stock that is poised for a trend change. Look for a bounce. WMT, despite being every one's favorite store, remains in the middle of an 8 year trading range. It is nowhere.

Technology (HPQ, IBM, INTC, MSFT) doesn't get me excited either. IBM is sitting at the bottom of a trend line drawn from the 1993 lows. INTC is back to the 2002 lows, which probably represents a good low risk entry point. The same can be said for MSFT, which is at the very bottom of an 8 year trading range.

Communication giants (T, VZ) aren't my cup of tea, but these stocks have bounced at their 2002 lows.

So who is left? DIS needs to base. KFT is at the bottom of a 5 year range near its all time lows. KO has done nothing for 10 years. PG has rolled over and is beginning a down trend.

That's 29 stocks, and not much happiness for investors.

So who is missing and who is that "last man standing"? It is McDonald's Corporation (symbol: MCD). A monthly chart is shown in figure 1.

Figure 1. MCD/ monthly
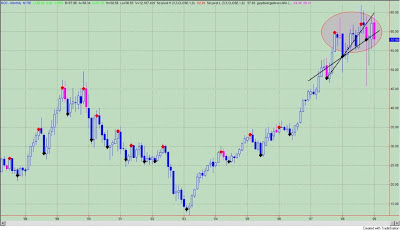
So why do I call MCD the "last man standing"? MCD remains near its all time high, and it is the only stock in the Dow 30 that really has not been effected by the bear market. It is the "last man standing". I bring MCD up because I believe it is putting in a secular top and on its way to joining its breathren. The technical negatives for MCD include: 1) multiple negative divergence bars (pink markers on price bars); and 2) upward sloping trend line breaks. A close below the 10 month moving average should provide confirmation of a top with prices falling to $45.

MCD will not avoid the scourge of the bear market.

Maybe The Bond Market Is Right

In a previous post on long term Treasury bonds, I reviewed some of the technical factors that have me bearish. "So it is highly likely, from this perspective, that Treasury bonds will be an under performing asset class over the next 12 months. But more importantly, will this market top lead to an investing opportunity (i.e., by shorting Treasury bonds)? In other words, will the market top lead to a secular trend change in Treasury bonds?"

On this, I am a little less certain. As we know, many (i.e., see the Barron's story, "Get Out Now") are calling for a top in Treasury bonds, yet as I contend, market tops don't occur when we all expect them too. Furthermore, I wonder if betting against bonds is a good strategy as a bet against Treasury bonds is a bet against the US Government. The Federal Reserve and Treasury have made their intentions known and are likely to support bond prices.

But what if bond market participants are right? What if they are buying not because there is a flight to safety (due to losses in other assets) but because they see value in borrowing at 0% and buying long dated Treasuries that yield between 2-3%? In a deflationary environment such as seen in a recession, this certainly makes sense.

In essence, buying bonds is really a bet that the Fed's reflationary policies will not work. Buying bonds is a bet that our economic malaise will continue much longer, and this notion is clearly supported by the data. See figure 1 a monthly chart of the yield on the 10 year Treasury bond. The indicator in the lower panel is an analogue representation of the National Bureau of Economic Research's (NBER) expansions and contractions. The NBER is the government organization that officiates over the beginning and ending times of a recession. On the graph, the gray vertical bars highlight recessions. The relationship between Treasury yields and economic contractions is easily seen. It would be highly unusual for yields to rise during a recession.

Figure 1. 10 Year Treasury Yield v. NBER/ monthly


Let's look at the relationship between Treasury yields and economic activity in another light. See figure 2 a monthly chart of the yield on the 10 year Treasury bond. The indicator in the bottom panel is 12 period rate of change of the Leading Economic Indicator data from the Economic Cycle Research Institute. As noted in a prior commentary, there is a very strong correlation between negative indicator readings and contracting economic activity. The gray vertical bars highlight economic contractions.

Figure 2. 10 Year Treasury Yield v. ECRI LEI/ monthly


In 10 out of the 11 instances sited, long term Treasury yields headed sharply lower during the economic contraction. The lone exception was in 1974, and yields went higher only to retrace that move once the expansion took hold.

If the past relationship between Treasury yields and economic activity is any guide, we should not see Treasury yields rise while the economy is contracting. However, once the Fed's policies begin to take hold and when the economy begins to expand, then it would seem more probable that a secular trend change for yields is on the horizon.

My bearishness on Treasury bonds is based upon the 'next big thing" indicator, which is a tool that I have developed that helps me identify the potential for a secular trend change in an asset. I have shown this indicator in figure 3, which is a monthly chart of the 10 year Treasury yield with the NBER data in the middle panel. Recessions are identified with the vertical gray bars and peaks in the indicator, which correspond to a bottom in yields, are noted with the maroon colored bars. The indicator is in the extreme zone, and once again, suggestive of a top in bonds or at the very least, Treasury yields should not go much lower.

However, the real story of figure 3 is this: bottoms in yields don't come during economic downturns, and more often than not a bottom in yields will come once the economic expansion is well on its way.

Figure 3. 10 Year Treasury Yield v. NBER v. "Next Big Thing"/ monthly


It does not seem likely that long term Treasuries will sell off (i.e., leading to higher yields) until the economic landscape improves. However, given the size of the Fed's stimulus response so far that sell off could be brutal once our economic fortunes improve. Given that the "next big thing" indicator is in the extreme zone, it is worthwhile keeping this asset class on the radar screen.

Tuesday, January 13, 2009

What Is It Going To Take?

What is it going to take before we see a bottom in stocks leading to a new bull market?

Time.

Time is the only thing that will heal this economy and heal the markets. Until sufficient time has passed, the markets are just treading water. The markets are likely to remain in a range between the November, 2008 lows and 1000 on the S&P500 for a very long time. That is ok as this buys time, which is what the markets need.

The markets have to consolidate in this range before they can move higher, and the only thing that investors have left to ponder is this: will the November, 2008 lows hold. I really think it is that simple.

It appears that prices are headed to those lows, and we should see the obligatory test and bounce. These lows should be bought by investors as this is what traders will be doing, and for those with a longer term perspective, this could represent an opportunity of a lifetime as stocks are on sale and likely be supported by value hunters.

Figure 1 is a monthly chart of the S&P500. The double bottom between the 2002/ 2003 lows and the 2008 lows is easily seen. What if the recent lows don't hold? Then I can see prices trading down to the very long term trend line drawn from the 1982 lows. This corresponds to about 690 on the S&P500.

Figure 1. S&P500/ monthly


Now all this is going to take time, and the longer the better. Figure 2 is a monthly chart of the S&P500, and the indicator in the lower panel is our "next big thing" indicator, which seeks to quantify technical factors seen at secular trend changes. Our current trend is bearish, and the indicator continues to rise suggesting that the potential for a bottom is months away. I say "potential" because the indicator only identifies when a trend change is likely; technical factors (i.e., a moving average crossover or some such other metric) are used for confirmation of a trend change. As you can see from the figure, this indicator has done a good job at identifying the bottoms seen 1974, 1978, 1982 and 2002. What did these bottoms have in common? They tended to be associated with high volatility and a sudden reversal of prices.

Figure 2. S&P500/ monthly


The bottoms seen in 1988, 1991, and 1995 are all noteworthy because the "next big thing indicator" didn't reach extremes levels seen in past bottoms. However, these bottoms (1988, 1991, and 1995) are low volatility bottoms and came about due to a prolong period of base building. In the current market enviroment, this kind of base building would take months of sideways price action.

I recently looked at another method of determining "When We Can Expect A Sustainable Price Move", and I came to a similar conclusion. If prices on theS&P500 traded at their average price over the past 2 months, it would take about 8 months before prices closed above the 200 day moving average.

Once again, it is all about time and there is no escaping the time factor.

Saturday, January 10, 2009

Key Price Levels: January 12, 2009

As suggested in the previous articles on sentiment, selling pressure materialized last week as none of the major indices could clear resistance levels. The SPY (S&P500 proxy) and DIA (Dow Industrial proxy) broke supports levels suggesting weakness; the QQQQ (NASDAQ 100 proxy) and IWM (Russell 2000 proxy) held at support levels.

To review the methodology and the significance of the key price levels please click on this link.

My interpretation of the SPY chart (see figure 1) is as follows: the 90.13 support level held all week until the last hour of trading on Friday. A weekly close below this level implies technical weakness and this should be concerning for the bulls. Old support is now resistance. The next support level (and likely the most important one) is at 86.78.

Figure 1. SPY/ weekly

Figure 2 is a weekly chart of the Dow Jones Industrial ETF proxy, the Diamond Trusts (symbol: DIA). Like the SPY, the DIA closed below a support level at 88.36; this is now resistance and a likely place where there will be selling pressure. The next level of support is at 82.64.

Figure 2. DIA/ weekly

Figure 3 is a weekly chart of the Power Shares QQQQ Trust (symbol: QQQQ). This past week prices remained above the most immediate support zone; this is between 29.72 and 29.36. This is still bullish and still a "normal" pullback. A weekly close above 31.06 would likely see prices fill the October, 2008 gap at $36.

Figure 3. QQQQ/ weekly


Figure 4 is a weekly chart of the i-Shares Russell 2000 Index (symbol: IWM). The support zone between 47.58 to 48.26 remains intact. A weekly close below this level would likely send prices to the next support zone at 42.48. A weekly close above 50.50 would likely send prices to the October, 2008 gap at $61.

Figure 4. IWM/ weekly

The positive price action of the prior week has turned to mixed price action this past week. I use the word "mixed" because support levels on the QQQQ and IWM held, but on the SPY and DIA, support levels did not. I guess all that other stuff -like the secondary indicators such as volume, news flow, economic fundamentals and sentiment - does matter.

Lastly, figure 5 is a daily chart of the SPY showing the short term oscillator constructed from various breadth and sentiment metrics. This is an over sold market. I would expect prices to bounce as the bullish case is always hard to extinguish, but it is my expectation that "selling strength" is the best course of action.

Figure 5. SPY/ daily

Investor Sentiment: Sell Strength (Again!)

Investor Sentiment: January 12, 2009

The "dumb money" and "smart money" sentiment indicators are neutral on the equity markets. While a neutral reading is not particularly telling regarding market direction, it should be noted that this is the fifth week in a row where the "dumb money" is neutral, and this is not a scenario that is generally supportive of higher prices especially with prices on the S&P500 under their 40 week moving average. The ideal situation for higher equity prices would be for the "smart money" to be bullish and the "dumb money" bearish (i.e., bull signal).

The "dumb money" or investment sentiment composite indicator (see figure 1, a weekly chart of the S&P500) looks for extremes in the data from 4 different groups of investors who historically have been wrong on the market: 1) Investor Intelligence; 2) Market Vane; 3) American Association of Individual Investors; and 4) the put call ratio.

Figure 1. "Dumb Money"
The "smart money" (see figure 2) refers to those investors and traders who make their living in the markets. Supposedly they are in the know, and we should follow their every move. The "smart money" indicator is a composite of the following data: 1) public to specialist short ratio; 2) specialist short to total short ratio; 3) SP100 option traders.

Figure 2. "Smart Money"


Hope for a better 2009 seen at the start of the year led to selling pressure last week putting the equity markets slightly in the red for the year. With neutral sentiment readings, we can no longer consider sentiment a factor in propelling prices higher, and because we have had 5 consecutive readings with the "dumb money" being neutral and with prices on the S&P500 below their 40 week moving, I have suggested that selling strength was the best course of action for those with a trading mindset. I define what I mean by "strength" in the article, "Investor Sentiment: Some Context".

Without sentiment playing a role, I like to think that stocks now must move higher on their own investment merit. They must prove themselves. What is going to be that catalyst? Another bailout program? Unlikely. Earnings? Unlikely. Better economic fundamentals? Unlikely. The only catalysts that come to mind are the hope for a second half recovery and the hope of an Obama presidency. No doubt both are compelling, but they are only hope. As I stated last week, this a bear market, and the strategy that has worked the best is sell hope, buy fear.

So what's next? Looking ahead it is unlikely that I will be bullish on equities for a multi week trade until the "dumb money" turns bearish (i.e., bull signal). And there are only two ways to bring out more bears. We either have lower prices or a protracted trading range that wears out investors.

Friday, January 9, 2009

Rydex Asset Data: Leveraged Bulls v. Leveraged Bears

I have presented a lot of data recently suggesting an intermediate term top for equities, and the weakness in prices this past week seems to be consistent with that view. Just as investors begin to embrace the hope that better times are coming, it's "bam" back to reality. This is still a bear market - sell hope, buy fear.

I have been reluctant to present the Rydex asset data for two reasons. One and as stated above, I have already presented enough data as to why I thought the market would stall at this juncture. Two, I have less confidence in the Rydex data due to the changing nature of this data set. Nonetheless, a reader asked me about the data, so here we go.

The Rydex Mutual Fund company provides data on how much money is going into each of their funds, so in this sense, we can see where investors are putting their own hard earned cash. In general, investors and traders have found the Rydex asset data useful as a contrarian tool. If, for example, there is too much money going into their money market fund, it means that Rydex investors are fearful of further stock market losses. So this would be a time to get long. The other thing useful about the Rydex Mutual Funds is that it allows investors to bet with or against the market and if their conviction is strong enough, the Rydex investor or trader can use leverage.

So why have I lost confidence in the Rydex asset data? Honestly, I am beginning to wonder whether it is still useful as a contrarian tool. Typically, I would bet against the Rydex investor as from 2002 to the end of 2007 it represented the "dumb money". Starting in 2008, betting with the Rydex investor has been a better strategy.

Why might the Rydex asset data become the "smart money"? I suspect it has to do with the proliferation of leveraged exchange traded funds seen over the past year. Prior to these ETF products, Rydex was one of the only games in town that allowed the use of leverage, that allowed intraday trading of their funds, and allowed betting against rising prices in the market. These features made Rydex unique until the new leveraged ETF's came along. To support this notion as to why the Rydex data might no longer be relevant is that the amount of money in their funds has decreased by about 30% in 2008 alone. Maybe the only money left at Rydex is the "smart money". Of course, only time will tell if this notion of mine is correct. Data like the Rydex asset data have a tendency to change as the times change. What was once considered extreme is no longer. Investors and markets change. Money finds another home.

As per the reader request, I present the amount of leveraged assets in the Rydex bull oriented funds versus the amount of leveraged assets in the bear oriented funds. Despite my concerns above, this is one of my favorite Rydex indicators. Not only can we see how these market timers are betting on market direction, but we can also see if they are doing so with conviction (i.e., leverage). Figure 1 is a weekly chart of the Power Shares QQQ Trust (symbol: QQQQ). The middle panel is the actual data of the Rydex leveraged bulls (green) v. leveraged bears (red). The indicator in the bottom panel takes the rate of change of this ratio and then looks for extremes in this value over the prior 52 week period.

Figure 1. Rydex Leverage Bull v. Leverage Bear


As you can see, the indicator has been above the upper band for several weeks now. Prior instances of the indicator being above the upper band have generally resulted in an intermediate term top or sideways movement of prices. These are noted with the purple vertical lines. Figure 1 looks at the period from December, 2004 to the present. Figure 2 looks at the period from December, 2001 to December, 2004. With the exception of April, 2003 (which was the blast off for the bull market), this indicator has done a very good job at identifying intermediate term market tops.

Figure 2. Rydex Leverage Bull v. Leverage Bear


So let's summarize. I have presented more sentiment data suggesting an intermediate term market top. Going forward, I still need to monitor the usefulness of the Rydex asset data.

Wednesday, January 7, 2009

Treasury Bond Bubble: Video Links

Two videos discussing the obvious to all bubble in the long term Treasury bond.

The first is from Barron's.


The next video is from CNBC and can be found by following this link.

Long Term Treasury Bonds: Update

I have been bearish on long term Treasury bonds long before it was fashionable, and this past week, Barron's has a cover story on Treasuries entitled, "Get Out Now!" It is their belief that "the bubble in Treasuries looks ready to pop, sending prices on government debt sharply lower."

More on the Barron's "call" below, but for now let's review the technical picture. See figure 1, a monthly chart of the 10 year Treasury bond. The "next big thing" indicator, which guages the probability of a secular trend change occurring within an asset, is in the bottom panel. As you can see, the "next big thing" indicator is in a position that would be consistent with past secular trend changes. These are indicated by the purple vertical bars, and with the exception of the signal in 2002, the indicator did a reasonably good job of identifying prolong periods of underperformance by Treasury bonds in what has become a 25 plus year bull market.

Figure 1. 10 Year Treasury Bond/ monthly


So the "next big thing" indicator only suggests that a market top is highly probable, and so the next thing to look for is some sort of price confirmation. Let's return to figure 1 and now focus on the gray ovals over the price bars. The gray ovals highlight negative divergences (pink bars) between price and an oscillator used to measure price momentum. More specifically, the pattern I am looking for is a cluster of negative divergences, and this is a pattern not only seen at important tops in bonds but multiple asset classes over various periods. There is already one negative divergence bar from 4 months ago (pink price bar with red arrows underneath), and there is a high probality that there will be another negative divergence bar in the next several months. In all likelihood, this would represent the "top" in bonds.

So it is highly likely, from this perspective, that Treasury bonds will be an underperforming asset class over the next 12 months. But more importantly, will this market top lead to an investing opportunity (i.e., by shorting Treasury bonds)? In other words, will the market top lead to a secular trend change in Treasury bonds?

That is more difficult tell. And one of the reasons, I state this is the fact that everyone is looking for it. It is right there on Barron's cover. Everyone now knows that Treasury bonds are a bad investment and this is rarely a recipe that leads to a secular trend change. Think back to the major trend changes of the past year. Crude oil topped out amid "calls" of $200 oil. The US Dollar Index bottomed amid "calls" for the crashing dollar. Markets rarely reverse when everyone expects them too.

So let's summarize. Long term Treasury bonds are in the topping process and do not represent a good investment. At this point in time, one could speculate in anticipation of a trend reversal in long Treasury bonds by selling strength in Treasury bonds. There are two investing vehicles that bet against Treasury bonds (i.e., higher yields), and these are the Ultrashort Lehman 20+ Year Treasury Proshares (symbol: TBT) and the Ultrashort Lehman 7-10 Year Treasury Proshares (symbol: PST).

Monday, January 5, 2009

Key Price Levels: January 5, 2009

As stated in this week's commentary on market sentiment:

"The most bullish thing about the price action has been the price action. All the secondary indicators such as sentiment, volume or market internals have not mattered.... The Russell 2000 and NASDAQ Composite have broken through resistance levels (albeit on sub par volume), and the S&P500 and Dow Jones Industrials have held at support and moved higher. This is all good - not only are prices headed higher but we know where are our points of failure (i.e., breaks of support)."

In the week ending on December 26, 2008, I expressed concern that the QQQQ (NASDAQ 100 proxy) and IWM (Russell 2000 proxy) had closed below support (old resistance) levels. The week prior the QQQQ and IWM barely and unconvincingly closed above resistance levels. This past week prices are now back above resistance levels, and all this has done is create a lot of whipsaws (i.e., in and out trading) in the QQQQ and IWM. This is not the norm and never fun.

The SPY (S&P500 proxy) and DIA (Dow Industrial proxy) have been above key levels for several weeks now, and this past week, these ETFs have closed above the next level. In the SPY and DIA, there have not been any hiccups (i.e., whipsaws).

To review the methodology and the significance of the key price levels please click on this link.

My interpretation of the SPY chart (see figure 1) is as follows: the price action has been good with five consecutive weekly closes over 86.78. Prices traded through resistance levels (90.13) as defined by the highs of the positive divergence bar. This (90.13) level becomes support; a weekly close below 90.13 would be technical damage and imply weakness and increasing caution. A weekly close over the pivot high at 92.89 is very bullish suggesting that prices could make it to $100.

Figure 1. SPY/ weekly

Figure 2 is a weekly chart of the Dow Jones Industrial ETF proxy, the Diamond Trusts (symbol: DIA). The key levels and positive divergence bars are noted. This past week, prices closed above near term resistance at 88.36; this now becomes support, and a weekly close below this level suggests weakness. A weekly close above 93.28 would likely propel prices to 103 and close the gap from October, 2008.

Figure 2. DIA/ weekly
Figure 3 is a weekly chart of the Power Shares QQQQ Trust (symbol: QQQQ). The past week prices closed above the support zone between 29.72 and 29.36. This is bullish and this zone now becomes support. A weekly close above 31.06 would likely see prices fill the October, 2008 gap at $36.

Figure 3. QQQQ/ weekly

Figure 4 is a weekly chart of the i-Shares Russell 2000 Index (symbol: IWM). Prices closed at the resistance level pivot of 50.50. Support is the old resistance zone of 47.58 to 48.26.

Figure 4. IWM/ weekly

There is no doubt the price action has been positive, and as stated above, all the secondary factors, like volume, the news flow, economy, and sentiment to name a few metrics, are substandard. I am not one to chase prices higher especially in a bear market that is short term over bought. Figure 5 is a daily chart of the SPY showing the short term oscillator constructed from various breadth and sentiment metrics. This is an over bought market. At the very least, I would expect sideways action before prices moved higher.

Figure 5. SPY/ daily

Investor Sentiment: Some Context

In my most recent post on investor sentiment, I suggested selling into strength and I suggested that the optimal time to do this was during this week. An astute reader asked the question: what do I mean by strength?

This is a great question because all too often market commentators make a "call" without the context of time (i.e., when things you predict might occur) or without the context of draw down (i.e., how much pain in the form of losses you have to suffer while being wrong before you get it right).

So let's define the question. I am basing my analysis on the following two observations: 1) investor sentiment, as defined by the investor sentiment composite indicator or "dumb money", is neutral for 5 consecutive weeks; and 2) price is below the 40 week moving on the S&P500 for 5 consecutive weeks. So the question becomes: when these two conditions are met, how does the S&P500 perform over the next 13 week period?

So we "buy" the S&P500 when both the "dumb money" is neutral and the S&P500 is below its 40 week moving average for 5 consecutive weeks. Positions are "sold" after 13 weeks or when the "dumb money" becomes bearish (i.e., bull signal). Commissions and slippage are not considered in the analysis. This is analysis is based upon 18 years of data.

If you only traded this strategy, you would have generated 11 trades. Only 2 of these trades would have been winners, and you would have lost 550 S&P500 points with only about 10% market exposure. This is quite significant. The majority of trades occurred in the 2001 - 2002 bear market or the current bear market.

But to give a little more context to the analysis and to try and answer the question of "what do I mean by strength", let's look at the maximum favorable excursion (MFE) graph for this strategy. See figure 1.

Figure 1. MFE


What is MFE? MFE measures how much a trade runs up before it is closed out for a loss or a win. Look at the caret in figure 1 with the blue box around it. This caret represents one trade. This trade ran up 2.5% (x-axis) before being closed out for a loss of 9% (y-axis). We know the trade is a loser because the caret is red.

So what can we tell from the MFE graph if we bought the S&P500 when both the "dumb money" is neutral and price is under the 40 week moving average? In 8 out of 11 instances, prices ran up less 2.5%. These are the carets in figure 1 to the left of the vertical blue line. Or to put it another way: the ultimate intermediate term top was identified within 2.5% of the initial signal in 8 out of 11 instances. In the other 3 instances, the S&P500 moved between 5% to 7% higher before heading lower.

So what do I mean by selling into strength? Based upon the scenario that I have defined, one can expect a top about two thirds of the time within 2.5% of the signal. We are now entering that window (i.e, the 5th week) where we would expect the market to begin to stall.

Sunday, January 4, 2009

Investor Sentiment: Sell Into Strength (Still)

This is the fourth week in a row where the "dumb money" is neutral and the "smart money" is bearish, and this is not a scenario that is generally supportive of higher prices especially with prices on the S&P500 under their 40 week moving average. The ideal situation for higher equity prices would be for the "smart money" to be bullish and the "dumb money" bearish (i.e., bull signal).

The "smart money" (see figure 1) refers to those investors and traders who make their living in the markets. Supposedly they are in the know, and we should follow their every move. The "smart money" indicator is a composite of the following data: 1) public to specialist short ratio; 2) specialist short to total short ratio; 3) SP100 option traders.

Figure 1. "Smart Money"


The "dumb money" or investment sentiment composite indicator (see figure 2, a weekly chart of the S&P500) looks for extremes in the data from 4 different groups of investors who historically have been wrong on the market: 1) Investor Intelligence; 2) Market Vane; 3) American Association of Individual Investors; and 4) the put call ratio.

Figure 2. "Dumb Money"


When combining the "dumb money" indicator with other metrics such as poor market internals and price under the 200 day moving average, we find that rallies tend to fail after 4 weeks of the "dumb money" indicator being neutral. We are now in that window where we expect the rally to stall.

Market participants remain hopeful to start the new year. The major indices have been driven higher on lackluster volume in anticipation of better times to come. Those hoping for a bottom can point to the market's persistence despite the bad economic news. They often make statements like: "the market is discounting the bad news and looking ahead" or "the market always bottoms before a recession ends". My response to such axiomatic dogma is two fold: 1) if the market is "all seeing", then what was the market thinking (or discounting) at the October, 2007 highs?; 2) the market bottomed almost 12 months after the 2001 recession ended so not all market bottoms occur at the trough of the recession.

Admittedly, the most bullish thing about the price action has been the price action. All the secondary indicators such as sentiment, volume or market internals have not mattered. Prices on the major indices have moved higher and key price levels have been met. The Russell 2000 and NASDAQ Composite have broken through resistance levels (albeit on sub par volume), and the S&P500 and Dow Jones Industrials have held at support and moved higher. This is all good - not only are prices headed higher but we know where are our points of failure (i.e., breaks of support).

But let's remember that this is still a bear market, and the winning strategy remains to sell hope and buy fear. We hope that the lackluster volume doesn't matter. We hope that increasing bullishness does not slow down the ascent of stock prices. We hope that breakouts don't turn into fake outs (which is a hallmark of bear markets). From this vantage point, the sentiment data I am presenting suggests that rallies are better selling opportunities.

Friday, January 2, 2009

Reconsidering Gold

Back in August, 2008, I wrote an article about gold essentially stating that the biggest threat to price appreciation in gold was price appreciation in the US Dollar Index. At that time, that was a good "call" as the the US Dollar Index is up about 10% from the July 31, 2008 close and gold is down about 5% from that time after having been down as much as 25%. I based that assessment of gold and the US Dollar Index on my "next big thing" indicator which looks for secular trend changes. Based upon this metric, the US Dollar Index looked better than gold than, and it still does so today.

So fast forward to today and we see that gold has closed the month above its simple 10 month moving average and above a down sloping trend line formed by two prior pivot high points. See figure 1, a monthly chart of gold. Typically and on a purely price action basis, I would consider this bullish. However, for gold, these technical milestones have failed to produce any meaningful edge especially when we apply other filters of the price action (such as the "next big thing" indicator). In other words, I don't believe that this represents the beginnings of a new secular up trend in gold.

Figure 1. Gold/ monthly


The "next big thing" indicator is shown in the lower panel of figure 1, and essentially, it is not in position where we would expect a new secular up trend in gold to develop.

As far as the US Dollar Index, I believe there is still some upside left in the current price move. Figure 2 is a monthly chart with the "next big thing" indicator in the lower panel. The indicator remains in a position (like back in August, 2008) that suggests a new up trend should develop. Furthermore, moves in the US Dollar Index typically end with a some sort of negative divergence between price and an oscillator. In other words, you don't see price thrust off the bottom (like it did in August, 2008) and then just fall apart. It would not surprise me to see the US Dollar Index test and fail at the December, 2005 highs. This is at least several months away.

Figure 2. US Dollar Index/ monthly

The obvious is that this analysis goes against the consensus opinion. The consensus opinion is that the Federal Reserve is printing money to do whatever it takes to cure the American economy. This is inflationary. And obvious to all observers.

However, the following isn't so obvious: despite all the creation of money, money is not being lent as lenders are reluctant to lend or borrowers are unable to borrow or money is going to pay off debt. I am grateful to one of our readers who sent me a chart of the M3 Money Supply (estimated) from John Williams' Shadow Government Statistics. Growth of M3 Money Supply and gold price appreciation should be roughly correlated, but what we find is that M3 Money Supply is decelerating despite the Fed's Herculean efforts. Essentially, money is not finding its way into circulation.

You can find the chart of the estimated M3 Money Supply by following this link.