


.png)
.png)
I am a day late getting the investor sentiment charts out this week. Regardless and as expected, the "dumb money" shows lots of bulls while company insiders continue to sell at a very strong clip. Investors don't seem too concerned - it is the end of the year and the Fed has back stopped the market. My take, which is NOT the consensus opinion, is that complacency is prevalent, and this in and of itself represents a significant headwind.
The "Dumb Money" indicator (see figure 1) looks for extremes in the data from 4 different groups of investors who historically have been wrong on the market
Market Vane; 3) American Association of Individual Investors; and 4) the put call ratio. The "Dumb Money" indicator has turned bullish to an extreme degree, and this is a bearish signal.
Figure 1. "Dumb Money"/ weekly
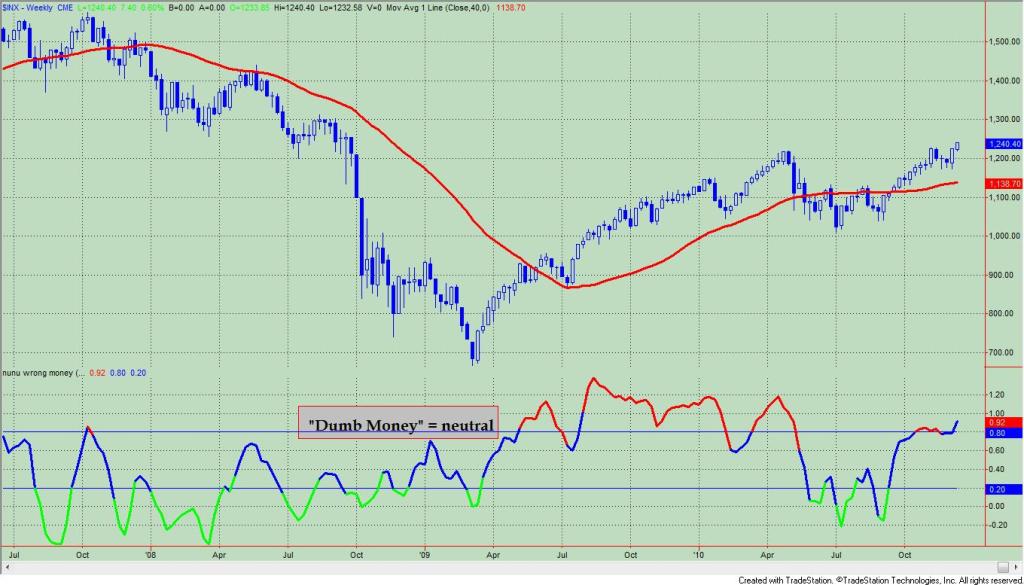
Figure 2 is a weekly chart of the SP500 with the InsiderScore "entire market ” value in the lower panel. From the InsiderScore weekly report: "There was no Thanksgiving hangover for insiders as corporate executives, directors and 10% owners started off the last month of 2010 with a heavy dose of sales. The number of sellers increased 38% week-over-week and came in just shy of the four-year set during the week ended November 9, 2010, Meanwhile, the number of Weekly Net Sell Clusters was its highest since June 2007 and its third-highest on record (dating to January 1, 2004). Selling was widespread, led by insiders at Russell 2000 companies - where the number of sellers was the second-highest on record...."
Figure 2. InsiderScore "Entire Market " Value/ weekly

Figure 3 is a weekly chart of the SP500. The indicator in the lower panel measures all the assets in the Rydex bullish oriented equity funds divided by the sum of assets in the bullish oriented equity funds plus the assets in the bearish oriented equity funds. When the indicator is green, the value is low and there is fear in the market; this is where market bottoms are forged. When the indicator is red, there is complacency in the market. There are too many bulls and this is when market advances stall.
Currently, the value of the indicator is 61.04%. Values less than 50% are associated with market bottoms. Values greater than 58% are associated with market tops.
Figure 3. Rydex Total Bull v. Total Bear/ weekly

Improve your market timing with Premium Content from TheTechnicalTake.
The Premium Content service is the best $104 you will ever spend on market research. The daily report is meant to keep you on the right side of the market and improve your market timing. That's 40 cents a day!
Even in this confusing market environment, The Premium Content service has been useful in identifying trading opportunities. The indicators have functioned as expected!!!
To learn more about this service click here: Premium Content
To subscribe to Premium Content click here: Subscribe


.png)
No comments:
Post a Comment