


.png)
.png)
Figure 1. QQQQ/ weekly

But then there was this sentiment thing that got in the way. No problem. Yesterday's reversal is constructive, but a weekly close above 27.63 would provide confirmation of higher prices.
Figure 2 is a weekly chart of the i-Shares MSCI Emerging Market Index (symbol: EEM). EEM is one of the few ETF's forming a nice base. First off, EEM did not violate the quarter 4, 2008 lows at 20.45. This is our support level, and any weekly close below 20.45 would be an ominous sign. The initial upside is 25.50.
Figure 2. EEM/ weekly


Figure 3 is a weekly chart of the i-Shares MSCI Brazil Index Fund. The breakdown of 4 weeks ago (red down arrows on chart) is this week's re-test. A weekly close above 36.50 would reverse this breakdown and lead to higher prices. In all likelihood, EWZ remains in the "box" (i.e., range) with the quarter 4, 2008 lows on the downside and early February, 2009 highs on the upside.
Figure 3. EWZ/ weekly
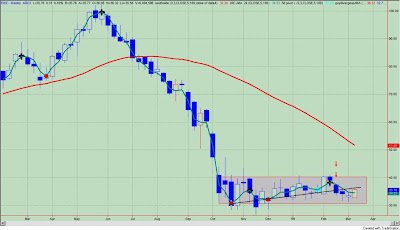

Figure 4 is a weekly chart of the i-Shares Dow Jones REIT Trust Index (symbol: IYR). The breakdown of 4 weeks ago (red down arrows on chart) is this week's re-test. A weekly close greater than 26.78 (resistance) would be constructive.
Figure 4. IYR/ weekly

Figure 5 is a weekly chart of the i-Shares MSCI EAFE Index Trust (symbol: EFA). This ETF represents developed countries in Europe, Asia and the Far East. EFA remains in a down trend, and yesterday's bounce appears to be nothing more than noise at this point in time.
Figure 5. EFA/ weekly


.png)
No comments:
Post a Comment