


.png)
.png)
Why bet against the market when it only goes up? After almost 2 years of a seemingly relentless upwards move with only one real buying opportunity, market participants have clearly become accustomed to the notion that the market never goes down. This is a sign of true complacency. I am not calling for a market top or the start of a bear market -- there are too many "Johnny come lately's" willing to buy at the sign of any weakness --but let's be clear: investors are becoming comfortable with the market. The dips are becoming shallower and I suspect the peaks (or time at new highs) won't last as long as well. While it is always important to buy low and sell high, I believe this will really be important going forward as the margin for error increases as sentiment becomes exceedingly bullish. This requires patience and discipline, which are characteristics few investors and traders demonstrate. I can easily be constructive on exposure to the equity market, but in the absence of a sell off, it is hard to see adding exposure.
The "Dumb Money
" indicator (see figure 1) looks for extremes in the data from 4 different groups of investors who historically have been wrong on the market Market Vane; 3) American Association of Individual Investors ; and 4) the put call ratio. This indicator is neutral.
Figure 1. "Dumb Money "/ weekly

Figure 2 is a weekly chart of the SP500 with the InsiderScore "entire market ” value in the lower panel. From the InsiderScore weekly report we summarize: Insider trading volumes remained thin as the week was shortened by the Good Friday holiday and normal seasonal factors kept insiders on the sidelines. Earnings season is kicking into gear this week and it will kick into high gear next week. The result will be a dramatic jump in the number of insider transactions as executives, directors and institutional owners react to earnings announcement.
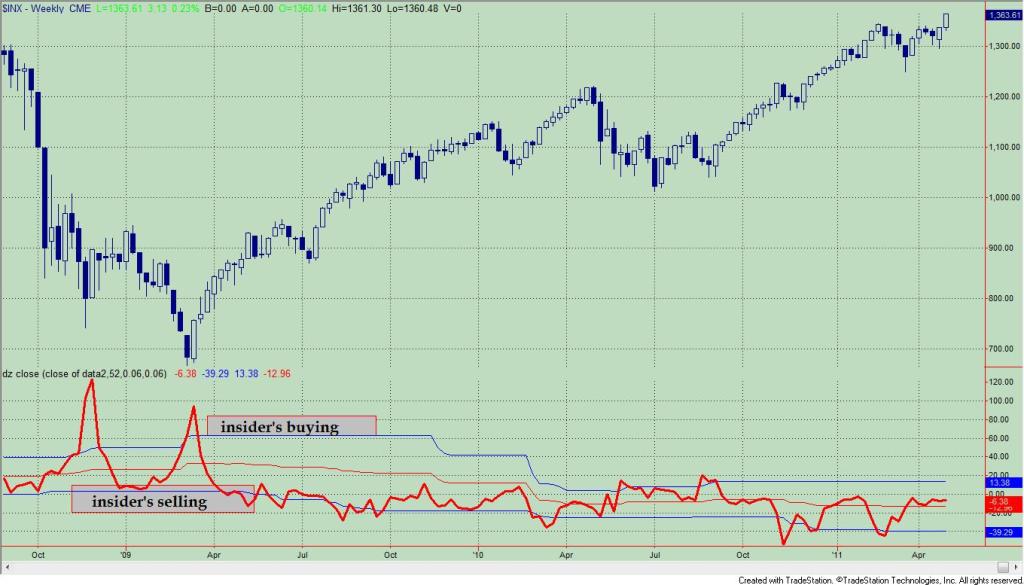
Figure 3 is a weekly chart of the SP500. The indicator in the lower panel measures all the assets in the Rydex bullish oriented equity funds divided by the sum of assets in the bullish oriented equity funds plus the assets in the bearish oriented equity funds. When the indicator is green, the value is low and there is fear in the market ; this is where market bottoms are forged. When the indicator is red, there is complacency in the market. There are too many bulls and this is when market advances stall.
Currently, the value of the indicator is 69.21%. Values less than 50% are associated with market bottoms. Values greater than 58% are associated with market tops.
Figure 3. Rydex Total Bull v. Total Bear/ weekly

Improve your market timing with Premium Content from TheTechnicalTake.
The Premium Content service is the best $104 you will ever spend on market research. The daily report is meant to keep you on the right side of the
Even in this confusing market environment, The Premium Content service has been useful in identifying trading opportunities. The indicators have functioned as expected!!!
To learn more about this service click here: Premium Content


.png)
No comments:
Post a Comment