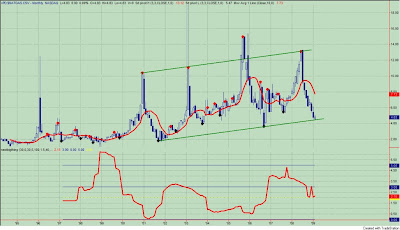
Figure 1. Natural Gas/ monthly

As you can see from this very long term view, natural gas has sold off rather nastily over the past eight months. Prices have found support at a long term trend line. While it is difficult to know for certain that this trend line will "hold", this is the kind of asset that picks my interest - down and out and off every one's radar. The "next big thing" indicator does not suggest a long term secular trend is at hand, but I am willing to wager that natural gas isn't going any lower for a while.
Put natural gas - and equities tied to natural gas- on your radar screen.


.png)
.png)


.png)
2 comments:
I was reading technical analysis on Nat Gas and seems that price should bottom out around $4.30.
Also, can you shed some light on Agriculture commodities as the 'next big thing'? I have been looking over some Agriculture ETFs and the volume is very very light. Seems no one is interested in trading Agriculture ETFs. On the other hand, Crude has been attracting a lot of attention has the volume on all the double ETFs are ballistic. But because everyone is in this camp, I feel there is more downside to crude.
What is your take?
hmmmm... Not so sure about that. The amount of Nat Gas discovered in the last few years will kep it in oversupply for a long time unless a lot of new usage is determined for it. Such as converting cars to run on nat gas instead of gasoline, etc... In the absence of that Nat gas is likely to continue lower or bounce along at these levels for a long time...
Post a Comment